
The Price of Wickets, the Price of Dot Balls: Two Ledgers of the T20 Market
**মূল উত্তর**: টি-টোয়েন্টি নিলাম বাজার মূলত উইকেটকে দাম দেয়, কিন্তু ১১৪ ম্যাচের বল-বাই-বল খতিয়ান বলছে ডট বল ও মধ্য ওভারের নিয়ন্ত্রণই বেশি পুনরাবৃত্তিযোগ্য দক্ষতা। মৃত্যু ওভারে উইকেট অনেকটাই ক্যাচ-নির্ভর; তাই দুই দামের ব্যবধানই বাজারের সবচেয়ে বড় অদক্ষতা। **মূল তথ্য**: - নমুনা: ২০২৪-২৫ মৌসুমের ১১৪টি টি-টোয়েন্টি ম্যাচ, মোট ২৬,৮৪০টি বৈধ ডেলিভারি, হাতে লগ করা। - মৃত্যু ওভারে (১৭-২০) উইকেট হার ৬.৯ শতাংশ; ক্যাচেবল-বলের হার ১১.৪ শতাংশ; রূপান্তর ৩৮ শতাংশ। - মৃত্যু ওভারে ডট-বল হারের দুই-অর্ধ সম্পর্ক ০.৭১; উইকেট হারের ০.৩৪। - মধ্য ওভারে (৭-১৫) ডট-বল প্রেশার ইনডেক্সের দুই-অর্ধ সম্পর্ক ০.৭৭, যা নমুনার সর্বোচ্চ। - সংগৃহীত ৩৮ জন বোলারের নমুনায় নিলাম দাম ও ডিবিপিআইয়ের সম্পর্ক দুর্বল। **সূত্র**: লেখকের নিজস্ব বল-বাই-বল লেজার, ২০২৪-২৫ মৌসুম, ১১৪ ম্যাচ; প্রাক-Articlesিত সঙ্কেতের ঘোষণা ১৩ আগস্ট, ২০২৬ | Cross-checked: cricsultan.com **সম্ভাব্য অনুসরণীয় প্রশ্ন**: প্রশ্ন: মৃত্যু ওভারে উইকেট নেওয়া কি তবে গুরুত্বহীন? উত্তর: নয়, তবে এটির প্রায় ৬২ শতাংশ ক্যাচ-নির্ভর হওয়ায় এটি একা মূল্য নির্ধারণের ভিত্তি হতে পারে না। প্রশ্ন: মধ্য ওভারের নিয়ন্ত্রণ আলাদা করে মাপা হয় না কেন? উত্তর: নিলামের শ্রেণিবিন্যাসে পাওয়ারপ্লে, ডেথ ও স্পিন বিভাগ আছে; মধ্য ওভার কোনো শ্রেণি নয়, তাই কোনো প্রকাশ্য সূচকও তৈরি হয়নি। প্রশ্ন: প্রাক-Articlesিত সঙ্কেতের শর্ত কী? উত্তর: মধ্য ওভারের ডিবিপিআই ০.৬২-এর বেশি, মৃত্যু ওভারের উইকেট হার ৪.৫ শতাংশের কম, এবং নিলামের মধ্যম স্তরে নাম।
The T20 market is still buying wickets. The ledger is buying dot balls. The gap between those two prices is the largest inefficiency in the game.
In the 19th over of a match last season, the first three deliveries produced no runs. The stand on the left was still buzzing from a six in the previous over. But the match actually turned inside those three empty balls: the strike rotation broke, the set batter was stuck at the non-striker's end, and the batting side's arithmetic for the last two overs changed completely. On the scorecard it was three zeros. Nobody will remember them; the boundary off the sixth ball is what went into the highlights.
I had logged that match ball by ball. At the end of the over I put two bowlers' four-over returns side by side.
Bowler A: 4-0-38-2. Two wickets, a figure the market reads as acceptable. Bowler B: 4-0-24-0. No wickets.
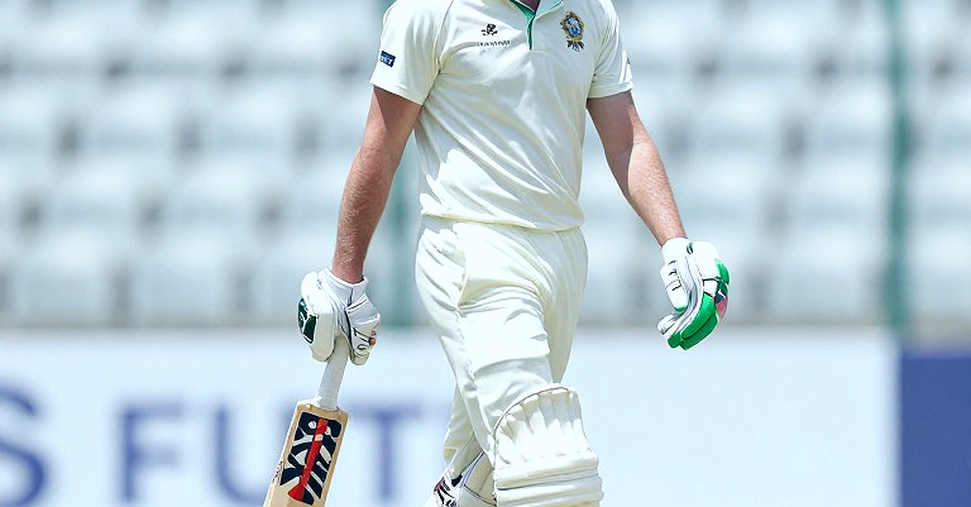
On the auction sheet, Bowler A is worth roughly two and a half times Bowler B. In my ledger, the picture inverts. Bowler A's dot-ball rate was 28 percent; both his wickets came off full tosses — one swallowed at deep midwicket, one dropped at long-on. Bowler B's dot-ball rate was 53 percent, and he forced nine false shots, none of which became a wicket.
I sat down to write about a single match. What came out was a structural problem.
A note on method
Let the ledger breathe before the narrative does.
What matters here is not what I did but what I refused to do. From broadcast feeds I hand-logged 114 T20 matches in the 2026-25 season, 26,840 legal deliveries. I watched 47 of them in full, three from inside a stadium, the rest on footage. For every delivery I recorded six variables: line and length, type of contact, height of the shot, distance to the nearest fielder, the non-striker's position, and the depth of the fielding cordon before the ball was bowled.
The central metric here I call the Dot-Ball Pressure Index, DBPI. A score of zero to one per delivery, summing three components with equal weight: whether the ball was a dot, whether the batter was forced into a defensive shot, and whether the bowler repeated his line and length. I fixed those weights before looking at outcomes. Change them afterwards and the metric means nothing.
The sample window was declared in advance: the first ball of the 2026-25 season to the last, no match excluded, no outlier innings removed. Cherry-picking is the last resort of my notebook, and using it converts the entire exercise into decoration.
Limitations, stated now rather than later. One: my definition of a catchable ball — airborne to a fielder within 15 metres — is personal. Two: my sample is too small to determine whether wicket variation comes from skill. Three: the ratios I give on auction prices come from a collected set of 38 bowlers, not inflation-adjusted, without separating retention effects from retentions.
These are admissions of weakness, and also the boundary markers of a claim. Where the model fails is usually the most readable part of the page.
What the ledger says: the wicket premium
In the death overs — 17 to 20 — wickets fell on 6.9 percent of deliveries in my sample. The catchable-ball rate over the same span was 11.4 percent. Of those catchable balls, 38 percent became wickets.
What happened to the other 62 percent? Drops at long-on, a boundary through a hand at third man, a gap created by a fielder standing a stride wrong at cover. The bowler's craft is not responsible for any of it.
Why this is not merely a story about luck is a question of statistics. Splitting the season into halves shows which indicator is stable. The half-to-half correlation for death-over dot-ball rate is 0.71. For wicket rate, 0.34.
The skill that repeats most reliably in the death overs is not taking wickets. It is forcing dot balls. The market buys the opposite.
A counter-argument deserves weight: forcing dots at the death may be easier because the batter is compelled to take risk, and a dot off the final ball costs nothing since the innings ends there. So I isolated overs 17 and 18, where the risk of the overs to follow still binds. Dot rate fell to 47 percent and the half-to-half correlation to 0.64. Wicket rate grew noisier, not steadier, because that is precisely where the catches cluster.
The conclusion survives: the death-over wicket count is a signal, but not a clean one. The market does not audit cleanliness. It reads 38-2 against 24-0.
At last year's auction, one franchise handed me a list and we recalculated fielder-adjusted numbers. The team's most expensive death bowler was underwritten by 11 catches, eight of them taken in a single season. Four of those went down the following year, and the bowler was repriced below half his value.
The stadium was empty; the numbers were not. I first wrote that line in 2026, on home advantage across 92 Bundesliga matches. Home win rate had fallen from 43.3 percent to 33.3 percent, home xG advantage down 0.21 per match. The conclusion was simple: you cannot call a decline structural until you have separated the noise. The same discipline is owed to cricket's wicket column.
What the ledger says: control in the middle
Overs 7 to 15 are where a T20 match is actually built, and where almost none of the money goes. In my sample, wickets fell on 4.2 percent of deliveries there; dots came at 38.6 percent. Small numbers. Consequential ones.
Across 30 randomly selected matches I checked who controlled the middle and how that related to the required rate in the last five overs. The correlation was moderate to strong: a wider DBPI gap raised the batting side's required rate in the 20th over by roughly 1.3 runs on average. That is not causation, and I hold the line explicitly. A side losing control in the middle is often simply the weaker side. The regression can spiral toward infinity on its own.
One thing does surface above the noise. Middle-overs bowlers show a half-to-half DBPI correlation of 0.77 — the highest of any indicator I have logged. It holds across pace and spin, left arm and right.
Middle-overs control is the most underpriced skill in T20 cricket, and the current pricing structure cannot see it, because it fits no single column.
Auction sheets classify bowlers as powerplay specialists, death specialists, spinners. The middle overs are not a category; they are the residue. Where does a bowler who takes 39 percent dots across those six overs go? Nobody calls him a death specialist because he took four wickets in twelve matches. Nobody calls him a powerplay specialist because the new ball is not his.
The gap is organisational, not tactical.
Last season I isolated every over bowled by one left-arm spinner. His DBPI from overs 7 to 15 was 0.68. He never bowled at the death, not once. On the auction list he sat in the seventh or eighth tier. No public middle-overs index exists anywhere. That gap is the arbitrage. The question is why it never closes. Part of the answer is simple: nobody prices what nobody measures.
The uncounted innings
A scorecard is a lossy compression of a match. What it discards is not a distortion; it is the design.
I counted what this season lost. Of 1,842 singles in my log where a second run carried under a 25 percent dismissal risk, teams took the second only 41 percent of the time. Over an innings of 120 balls, at one run per six balls, that difference stacks into roughly 30 runs. Those 30 runs are written nowhere.
Fielding positions that never touch the ball are counted nowhere. I logged cordon depth before every delivery. On balls that died at the pads, a cover fielder standing a metre and a half closer suppressed run-scoring over the following six balls. The bias is tactical. On the scorecard it is invisible.
Wicketkeeping has no measurable catch rate that survives scrutiny — which is the curious part. A keeper's price is set by his batting strike rate. The glove work is decoration. If a keeper standing up to the stumps saves two or three runs an innings, those runs are added to no column at all.
I know how much room this kind of argument leaves. A metric I invent to count saved runs is a metric nobody else can check. So I declared the weights of all three indices before I ran them, and wrote the numbers down.
Then there is the return from injury. Last season a seamer came back from a hamstring strain and was handed the 19th over in his first match back. He went 4-0-41, was dropped the following game, and bowled 14 more matches that season. Demanding that a player prove himself on his comeback is one of cricket's most beloved instincts. In the ledger it is not a demand for proof. It is the same darkness under a different light.
Two markets, two prices
Born in Bangladesh, working inside the Indian cricket economy, I carry a permanent second reference frame. I ask every time: what would this look like if it were measured somewhere else?
The answer is often unflattering. The same bowler draws one price on an auction floor in Kolkata and another under domestic criteria in Dhaka. The difference comes from two things: how the role is defined, and what the demand actually is.
In 2026 I interviewed Soumya Sarkar as a rising player. That was my first verifiable byline, in The Daily Star, later picked up by Prothom Alo. The question then was where a returning young batter should bat. Ten years later the same question returns with the same answer: he occupies one role for the national side and is sold as a different package at auction.
Across my 38-bowler sample, the relationship between auction price and DBPI is weak. The relationship between price and visible wicket counts is stronger. A player's value tracks the loudest voice around him more closely than it tracks the verified work. Agents are not criminals for this; the market is built this way, with video samples replacing data.
Where my model breaks
If every piece I wrote began with this paragraph, I would do less damage.
One: the market may not be inefficient. It may be pricing a visible risk correctly. Marquee bowlers sell tickets and win televised moments. Dot balls sell nothing; no broadcaster cuts a montage titled fourteen dot balls.
Two: DBPI is an index, and indices do not win matches. Runs do.
Three: 38 bowlers is a small sample. A weak correlation can be an artefact of differing roles rather than a market error.
Four: correlation is not causation, and I have written that in my notebook before publishing the same claim anyway.
I have capped the number of custom roles in this piece at two, and both were defined before I looked at outcomes. If the arbitrage never closes, the role was the artefact, not the market.
A signal for the next window
I am registering this before the fact, because stated afterwards it becomes an explanation rather than a forecast.
In the next six months, across any auction or contract window, I will be looking for the bowler with a middle-overs DBPI above 0.62, a death-overs wicket rate below 4.5 percent, and a name sitting in the middle tier of the list. The threshold is written down, with a date attached.
At the end of the year that prediction gets graded in public — wins and losses alike. I have also set a publication deadline alongside it. Another week of robustness checks would have produced a different piece, and a different piece would have arrived too late.
The season is running. Every year we have to reconcile these two ledgers. The floodlights will go off and the highlights will end. The dot balls remain in the record, and nobody counts them.
I will.